Retrieving data using the web client
The EPICS Archiver Appliance supports data retrieval in multiple formats/MIME types. These are some of the few formats supported today; more can easily be added as needed.
JSON - A generic JSON format that can be easily loaded into most browsers using Javascript.
CSV - Can be used for importing into Excel and other spreadsheets.
MAT - This is the file format used for interoperating with Matlab.
RAW - This is a binary format used by the Archive Viewer and is based on the PB/HTTP protocol.
TXT - A simple text format that is often helpful for debugging.
SVG - A XML format that can also be used as a SVG element in tools that support this format.
For GUI clients such as CS-Studio, Archive Viewer, and Matlab, see their respective how-to guides: CS-Studio, Archive Viewer, Matlab.
Constructing a data retrieval URL
Getting data into a tool necessitates construction of a data retrieval URL as the first step. A data retrieval URL looks something like so
where
http://archiver.slac.stanford.edu/retrievalis thedata_retrieval_urlelement from yourappliances.xml/data/getDatais the path into the data retrieval servlet and is fixed..jsonidentifies the MIME-type of the returned data.The remainder consists of parameters (all of which need to be URL encoded for correctness)
For optional request parameters and the full response field reference, see Retrieval API.
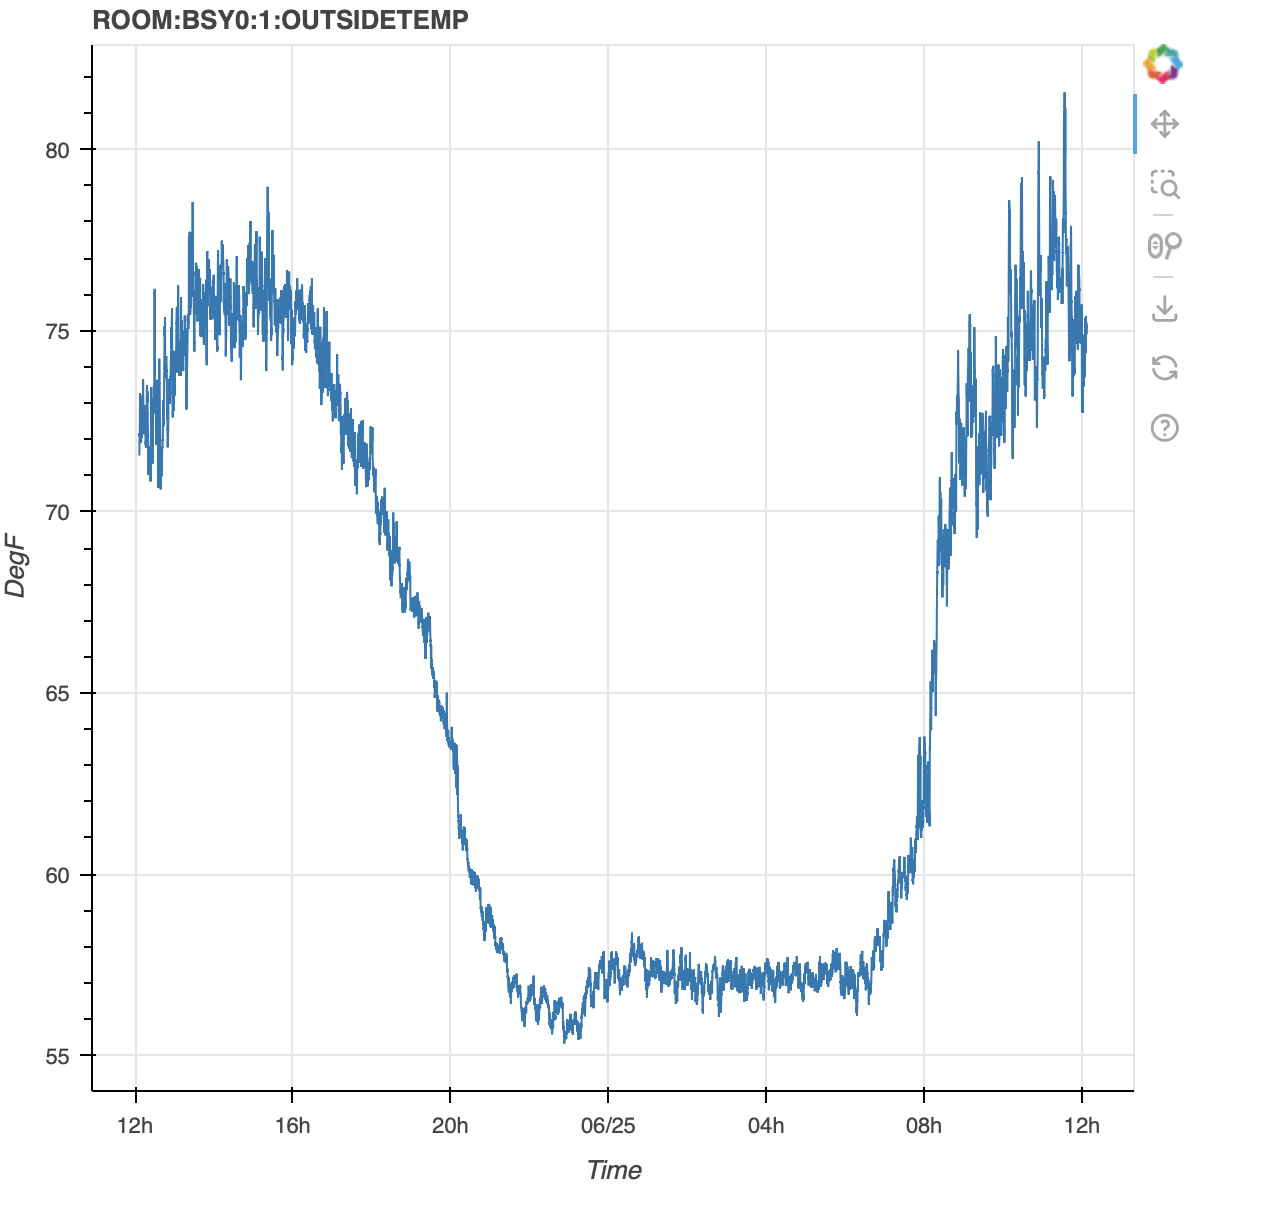
Example: fetching data in Python
Here’s an example of loading data into Python in a Jupyter notebook and using Bokeh to display the data
from datetime import datetime, timedelta
import pytz
import json

import requests
from bokeh.plotting import figure, show
from bokeh.io import output_notebook

utc = pytz.utc
tz = pytz.timezone('America/Los_Angeles')
end = datetime.now().astimezone(utc)
start = end - timedelta(days=1)
pvName = "ROOM:BSY0:1:OUTSIDETEMP"

resp = requests.get("http://archappl.epics-controls.org/retrieval/data/getData.json",
        params={
            "pv": pvName,
            "from": start.strftime('%Y-%m-%dT%H:%M:%S.%fZ'),
            "to": end.strftime('%Y-%m-%dT%H:%M:%S.%fZ'),
        })
resp.raise_for_status()
samples = resp.json()[0]["data"]
egu = resp.json()[0].get("meta", {}).get("EGU", "")
xpoints = [datetime.fromtimestamp(x["secs"]).astimezone(tz) for x in samples]
ypoints = [x["val"] for x in samples]

output_notebook()

fig = figure(title=pvName, x_axis_label='Time', x_axis_type='datetime', y_axis_label=egu)
fig.line(xpoints, ypoints)
show(fig)